As we step into a new month, it’s time to reflect on the remarkable achievements of our trading community and delve into the exciting developments that transpired in July. This month’s recap not only highlights the market trends but also unveils the impressive profit share that underscores the success of our traders.
July’s 15% Profit Share from the Challenge Phase
In the spirit of transparency and partnership, we are thrilled to share that a grand total of $977,350 was disbursed to our traders as part of the 15% profit share from the challenge phase in July.

This profit share represents a tangible testament to the prowess of our traders, who navigated the market with precision and skill, transforming opportunities into profits. We take immense pride in empowering our traders to reap the rewards of their hard work and strategic decisions.
Market Insights: A Glimpse of July’s Payouts
Now, let’s delve into the captivating world of trading trends and market dynamics that defined the month of July:
Top Payouts
Throughout July, the market showcased its ever-evolving nature, presenting traders with a spectrum of opportunities. The top 5 payouts for the month are as follows:
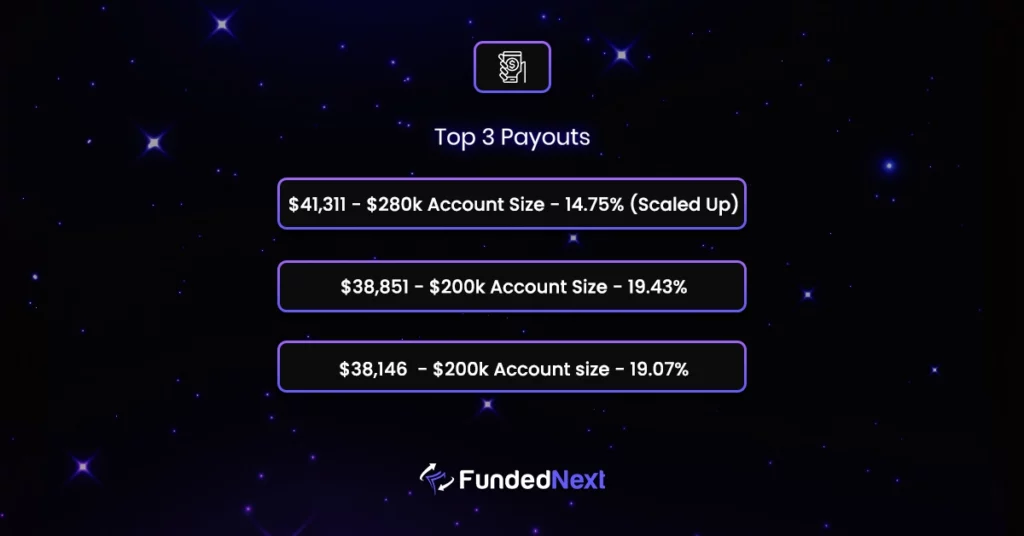
- $41,311 – 280K Account Size (Scaled Up) – 14.75%
- $38,851 – 200K Account Size – 19.43%
- $38,146 – 200K Account Size – 19.07%
These significant payouts stand as a testament to the dynamic nature of the market and the strategic acumen of our traders, who seized opportunities and made informed investment decisions.
Monthly Trading Stats
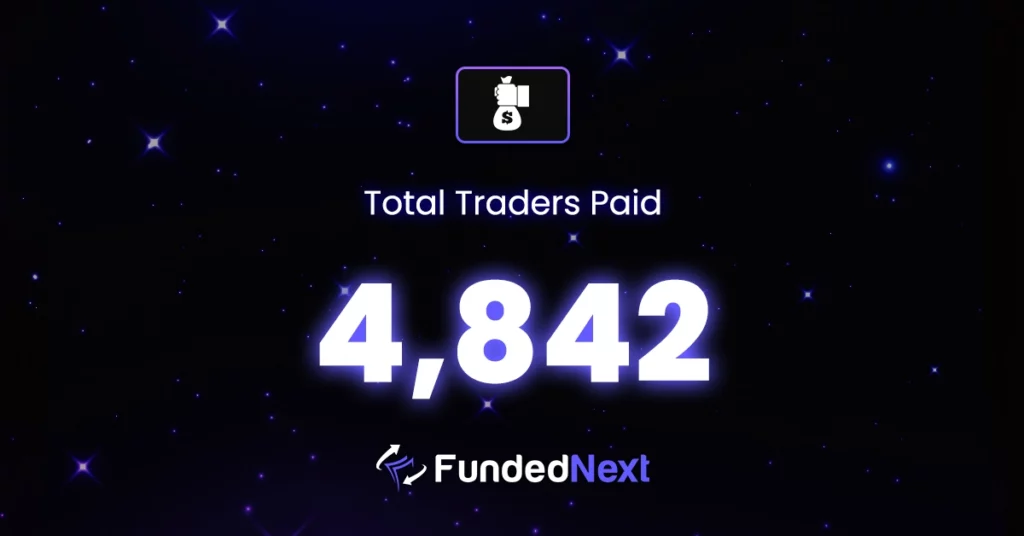
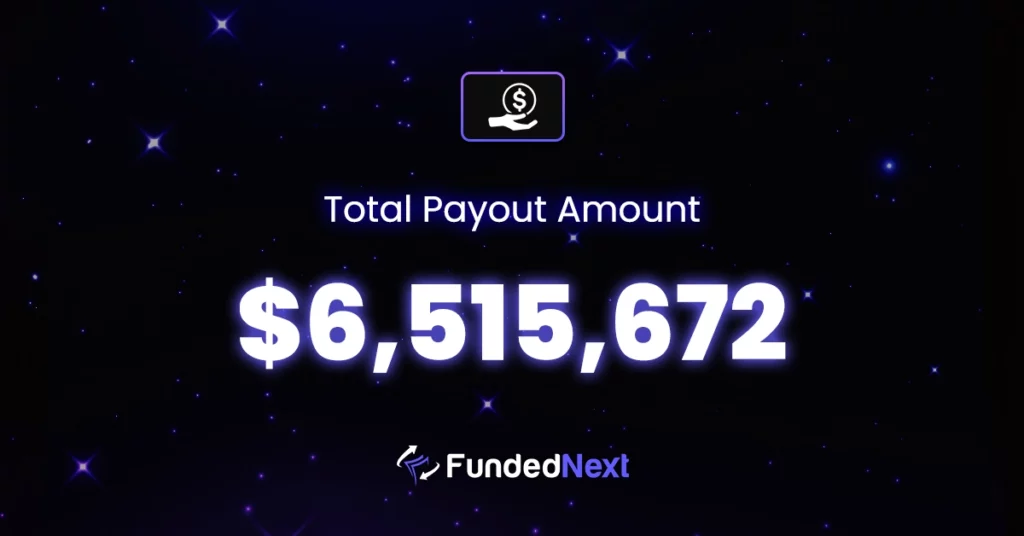
The previous month witnessed a vibrant trading environment, with traders collectively earning a substantial payout of $6,515,672 distributed among 4,842 individuals. This figure emphasizes the active participation of our trading community, where well-thought-out investment choices translate into impressive profits.
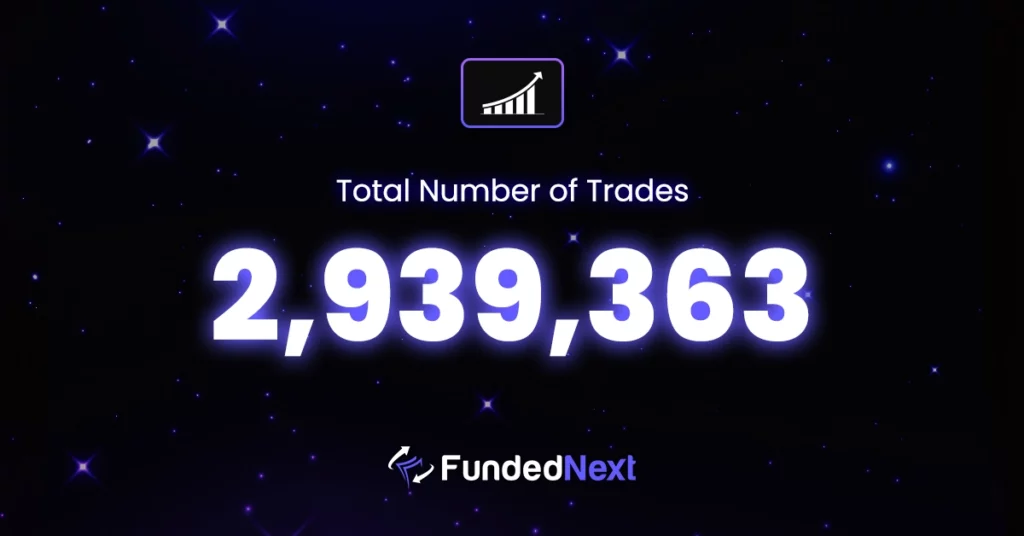
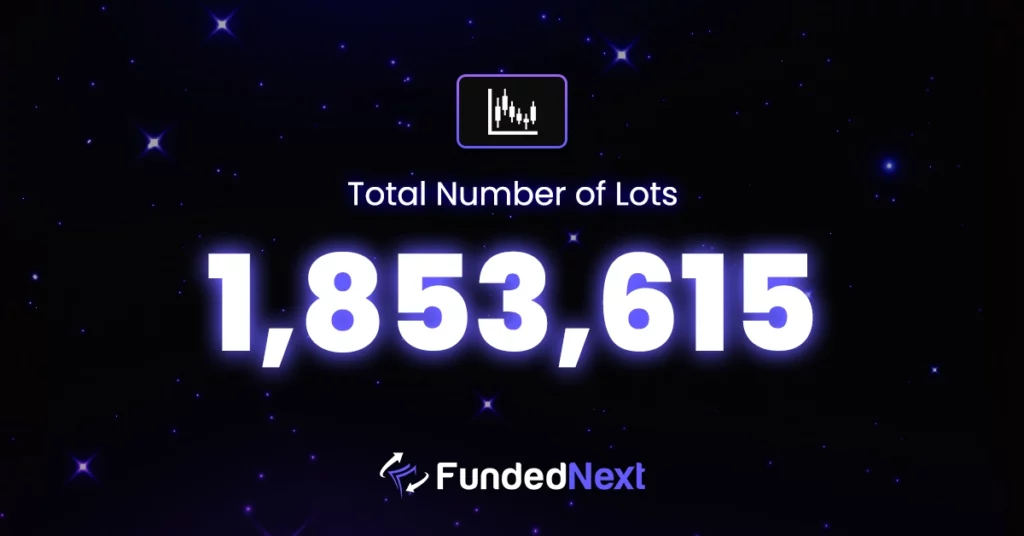
Throughout the month, 2,939,363 trades were executed, involving a total volume of 1,853,615 lots. These figures underscore the vibrancy of the trading landscape, characterized by its ever-fluctuating dynamics and profit potential.
Monthly Trading Instruments
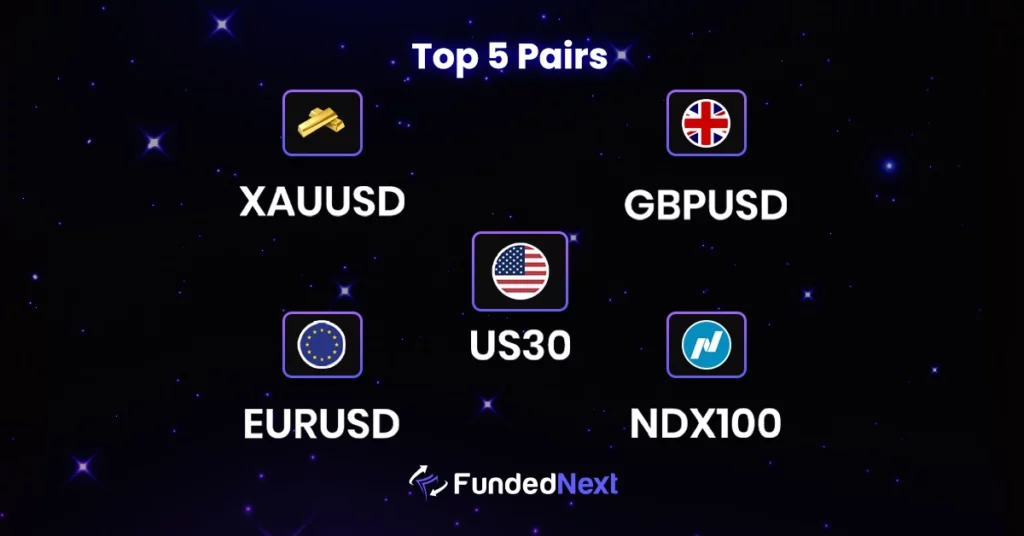
The familiar currency pairs and instruments continued to capture the attention of traders, offering volatility and potential rewards. Notable pairs that drew substantial trading volume during July include XAUUSD, EURUSD, US30, GBPUSD, and NDX100. The popularity of these pairs reflects their appeal to traders and investors seeking profitable opportunities.
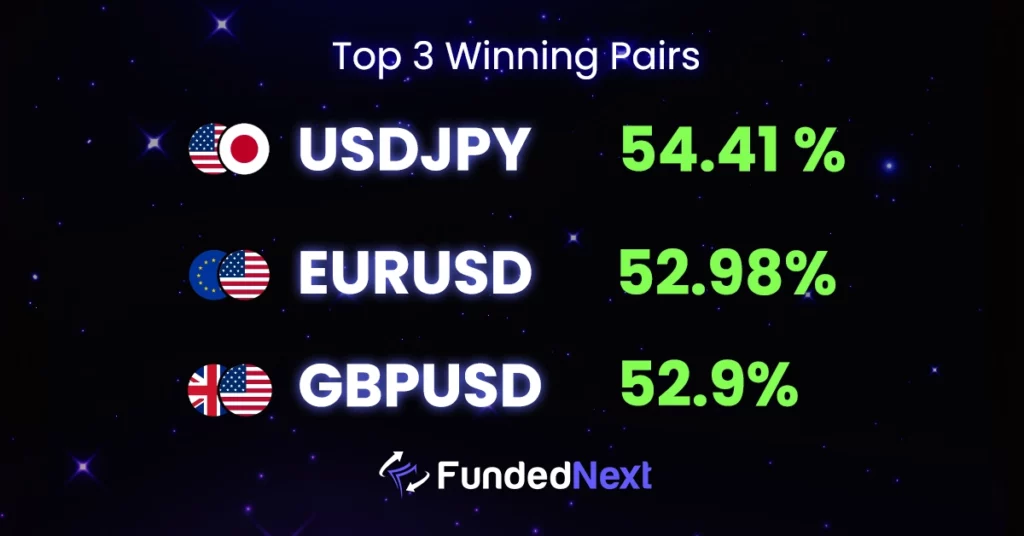
Among currency pairs, USDJPY, EURUSD, and GBPUSD showcased favorable performance, boasting winning percentages of 54.41%, 52.98%, and 52.9% respectively. These figures highlight the potential for profit in these pairs and the skill of traders who engaged with them.
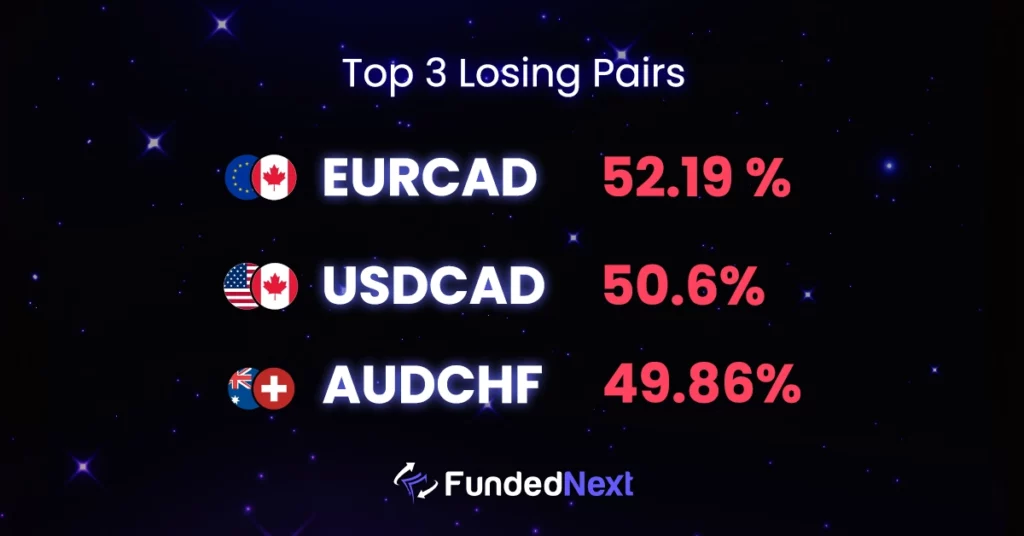
Conversely, the EURCAD, USDCAD, and AUDCHF currency pairs faced challenges, recording losing percentages of 52.19%, 50.6%, and 49.86% respectively. These statistics serve as a reminder of the risks inherent in trading and the importance of well-informed decision-making.
|| Dollar’s Rollercoaster Ride, Gold’s Delicate Balance, and the Currency Tug of War: The Explosive Financial Showdown of the Last Month! ||
- In a breathtaking turn of events, the US Dollar Index (DXY) soared above the 102.00 mark last month. However, it didn’t manage to maintain that altitude and seemed to struggle with the weight of its own performance.
The index came face-to-face with the next challenge at 102.60, but whether it succeeded in overcoming that hurdle remains a thrilling question. Despite a potential threat from the 200-day SMA at 103.78, the Dollar held on. - On the Gold front, the stage was set by interest rate speculations and an impressive 2.4% surge in the US economy’s annualized growth. The ghost of aggressive rate hikes was successfully exorcised, at least for now, fostering an environment where the Gold market could thrive.
However, the expected rate cuts for the following year added to the drama, leaving us on the edge of our seats as we watched Gold prices hover precariously between economic events and anticipated rate changes.
EUR/USD:
- Last month, the Euro-Dollar pair displayed an intriguing performance. Despite slipping to 3-week lows near 1.0940, it managed a last-minute comeback, finishing the month slightly above the 1.1000 mark. The long-term outlook for the pair remained optimistic, provided it kept its footing above the 200-day SMA at 1.0718.
- The Euro-Dollar pair performed an interesting dance last month. It stumbled, reaching 3-week lows near the 1.0940 mark, only to recover and end the month a touch above the 1.1000 mark.
Despite the turmoil, as long as the pair managed to maintain its balance above the 200-day SMA, currently sitting at 1.0718, the future held promise. The suspense as to whether the pair could dive towards the 1.0900 regions added to the plot, offering investors a nail-biting thriller.
GBP/USD:
- The British Pound had its work cut out last month. The initial resistance levels spotted at 1.2878/83 and 1.2997 set the stage for a possible Sterling showdown.
The pair risked falling to the 55-DMA and price support at 1.2676/58, yet the possibility of fresh buyers stepping in to invigorate the broader uptrend created an interesting dynamic. Only time would tell if the Sterling had the strength to reverse the core uptrend or if further decline awaited.
AUD/USD:
- The Australian Dollar had a tough time keeping up with the USD’s strength last month. Falling to a nearly three-week low, it became evident that the AUD was feeling the heat.
As the market keenly awaited the release of the US Core PCE Price Index, it was clear that the AUD/USD pair was under the spotlight. The drama surrounding the Federal Reserve’s next policy move only served to heighten the tension.
NZD/USD:
- The New Zealand Dollar was under pressure, recording a losing streak that lasted three days. A tumble below the 200-SMA and a crucial short-term support line marked the beginning of a challenging phase for the Kiwi. As the market’s anticipation of the Fed’s Core PCE Price Index grew, so did the tension surrounding the Kiwi’s fate.
USD/CAD:
- The US Dollar and the Canadian Dollar squared off for an interesting matchup last month. The pair experienced modest gains, edging towards the 1.3250 mark.
For the USD to assert its dominance, it needed to breach the 1.3250 mark, a challenge that kept investors and analysts on their toes. The struggle was real and the excitement palpable.
Commodities
Gold:
- Gold’s story last month was one of struggle and resilience. It tried to recover from a substantial loss, wrestling with conflicting signals from the Federal Reserve and escalating US-China tensions.
The market sentiment hung by a thread, teetering between the Fed’s Core PCE Price Index and the chances of a potential rate hike.
Silver:
- The tale of Silver was a bitter-sweet one. Despite bouncing back from a two-week low, the commodity remained under bearish control. Yet, hope was not entirely lost, as the presence of key resistance around $24.70 indicated that the bears were not completely in charge.
The 50-DMA support of $24.00 remained a crucial level for the Silver price, suggesting that the month had been a roller-coaster ride for the metal.
Oil:
- Western Texas Intermediate (WTI) was on a roll last month, trading near the $79.40 mark, its highest level since mid-April. The upbeat US economic data, coupled with expected supply reductions, fueled its upward journey.
With the market keeping a close eye on the US Core PCE index and the upcoming OPEC+ group’s JMMC meeting, WTI’s ride was far from over.
Watch Out for August Important Dates:
- On 10th Aug, the United States CPI report has come out. A general rule of thumb is a higher-than-anticipated figure should be viewed as positive (bullish) for the USD, while a lower-than-anticipated figure should be viewed as unfavorable (bearish).
- On 31st Aug, the United States Initial Jobless Claims report will have a significant impact on US bond and stock markets. A higher-than-expected figure should be seen as negative (bearish) for the USD while a lower-than-expected figure should be seen as positive (Bullish) for the USD.
- It is important to pay attention to the United States Nonfarm Payrolls Private report on the 4th of Aug, as it may have significant impacts on major currencies. A higher-than-expected figure should be seen as Positive (bullish) for the USD while a lower-than-expected figure should be seen as negative (bearish) for the USD.


