One of the fundamental trading lessons is to understand and implement trading indicators and strategies. On the path to becoming a master trader, trying and testing out different trading strategies is a must. And among all of them, Bollinger Bands is one of the easiest and most accurate indicators on the trading platform. In this blog, we will give an overview of Bollinger Bands and how impactful it is for traders, especially scalpers in the market.
The best thing about the Bollinger Bands indicator is its simplicity. You can only be sure about how the market will move almost accurately if you use the bands’ indicator. It is basically a technical analysis tool made up of a set of trend lines plotted to two standard deviations, both up and down, that are away from a simple moving average of a security’s price but can be customized. Traders use this to figure out how the market is doing by averaging the data on how prices have moved in the past. With the assistance of the Bollinger Bands, traders can make profits from even the smallest market moves.
John Bollinger, a well-known trader in technical analysis, constructed the Bollinger Bands so that investors would have a better chance of knowing when an asset has been oversold or overbought. The indicator is available on most chart platforms.
What Does Bollinger Bands Look Like?
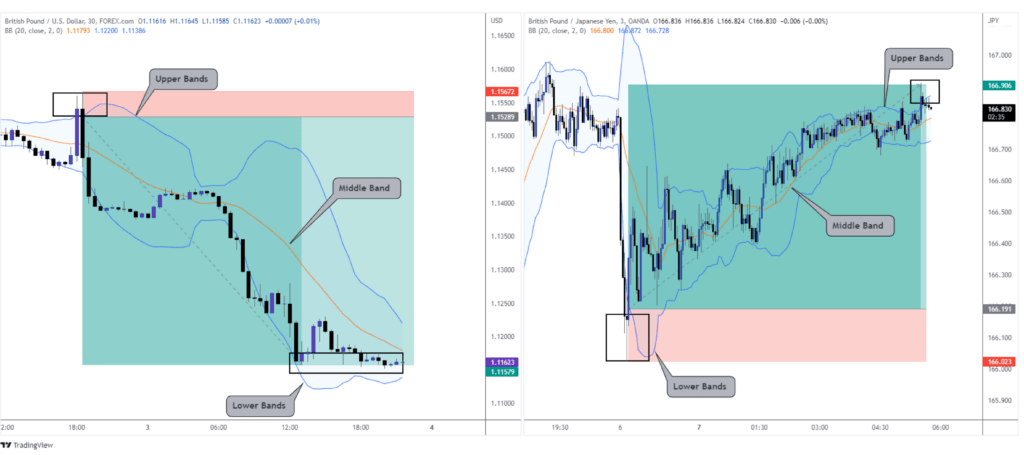
Bollinger Bands refer to the bands placed on a chart to represent the market volatility range. It is the trend or the volatility indicator. Bollinger Bands has three components:
1. Upper Bands
2. Lower Bands
3. Middle Bands
Looking at the indicator settings, we can see there are two parameters.
1. Periods
2. Standard Deviations. It determines how overstretched the market is. It is divided into the Middle Bands, Upper Bands and Lower Bands.
The default parameter for period is 20, and the standard deviation is 2. It is customizable.

Things to Remember:
1. 95% of price action is contained within a standard deviation of 2 of the Bollinger Bands
2. 99% of price action is contained within a standard deviation of 3 of the Bollinger Bands
3. Lower setting will generate more trading signals but increase the false signals
4. Higher setting will generate fewer trading signals but decrease the false signals
How Does This Strategy Work?
If you are a scalper, then you must look for flat Bollinger Bands. When the price reaches the upper band, it is called overbought, and when the price approaches the lower band, it is considered oversold. This upper and lower band can act as dynamic resistance and support levels, as traders generally avoid buying when the asset price hits the upper Bollinger Bands, respectively.
Short Trade- When the price touches the upper band and closes above it, we go short and exit the trade when the price touches the lower band and closes below it.
Long Trade- When the price closes below the Bollinger Bands and we place a buy order, the price will eventually touch the upper band in the future, and that is the time when we exit the trade.
What are the Indications You Will Receive from the Bollinger Bands Indicator?
1. Trend continuation or reversal
2. Periods of consolidation
3. Large volatility breakouts
4. Potential price target
There is no Stop Loss Indication in the Bollinger Bands trading strategy. It is a bit of a risky trading strategy, but a sure shot. According to the experts, this strategy works best for the hourly time frame as the entry signals are more reliable in this setup.


4 Responses
After reading this blog on Bollinger Bands, I feel much more confident in understanding how to use this indicator for scalping strategies. The author did a great job of explaining the different components and parameters of the Bollinger Bands in a simple and easy-to-understand way.
Thank you so much for your support. We are glad to help you out.
I found this blog on Bollinger Bands to be informative and useful for anyone interested in scalping strategies. The author’s writing style is engaging and easy to follow, and the explanations are thorough without being too technical. I feel more confident in my ability to use this indicator for my trading activities.
We appreciate your comment